
Cone of Uncertainty
Usually when we think about an estimate, we think about a single number. For example, 100 man-days or 100 story points. However, what does this number represent? Is it a positive outcome or negative outcome? Is this estimate rough or precise? Can we adjust that estimate based on the risk factor? All of these questions are great and legitimate because, first of all, we must say that the estimate is a probability measurement and does not belong to the subset of exact numbers.
A method for accounting for uncertainty in estimates is the use of a range of values instead of a single-point estimate. Instead of determining the project cost as one specific number, a range of possible values can be identified, covering the planned estimate while considering uncertainty. This allows for the possibility of changes during the project and prepares for them in advance.
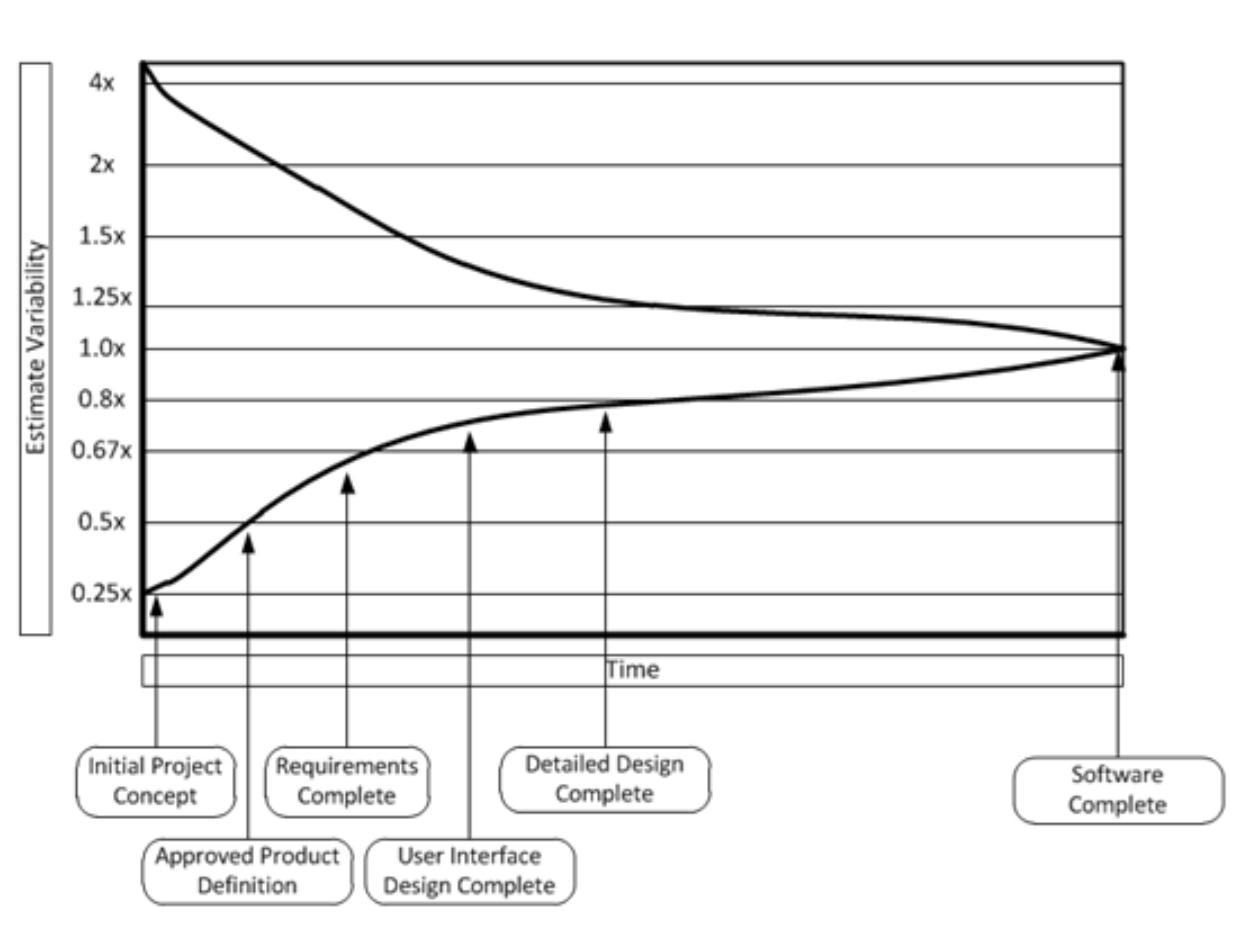
This figure you can see on the picture is called “cone of uncertainty,” a concept that visualizes the levels of uncertainty in the process of developing a software project. As the project progresses, the understanding of requirements and conditions remains vague and unclear. At the very beginning, the cone is wide, indicating a high level of uncertainty. At this stage, many factors can affect the final outcome. Implementation possibilities, technological limitations, changes in client requirements—all of this creates significant “noise” around the project. Over time, as requirements are refined and tasks clarified, the cone begins to narrow. Initial uncertainty is replaced by clearer expectations and a better understanding of the final product. As the project approaches completion, the level of uncertainty becomes minimal, and teams can confidently estimate costs and timelines.
Let’s review an example. Suppose we have a project with just a single line as a requirement. Let’s say “Implement a Payment Gateway solution.“ In the beginning, the vast number of the requirements are not clear. For example, what this gateway will be used for, which payment methods it will support, what interfaces are the most important for the end user. We can identify this stage as “Initial Project Concept.”
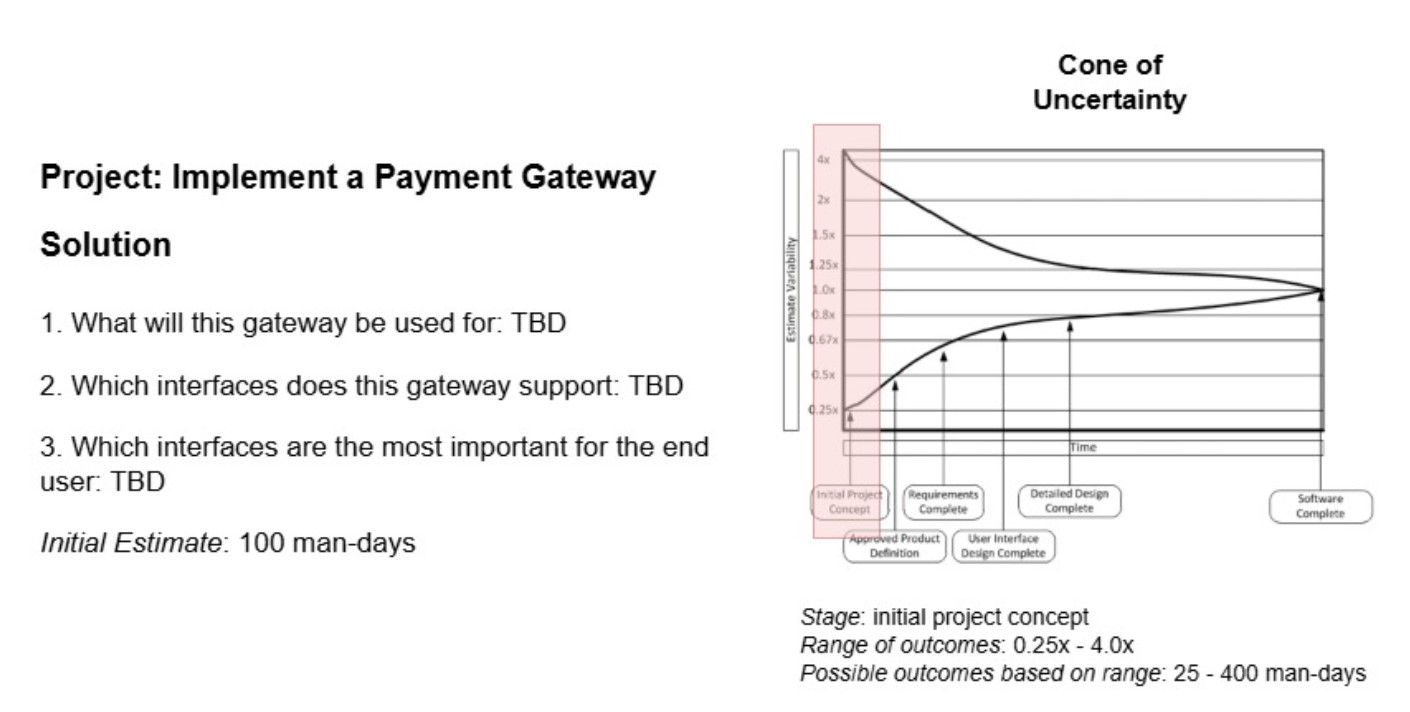
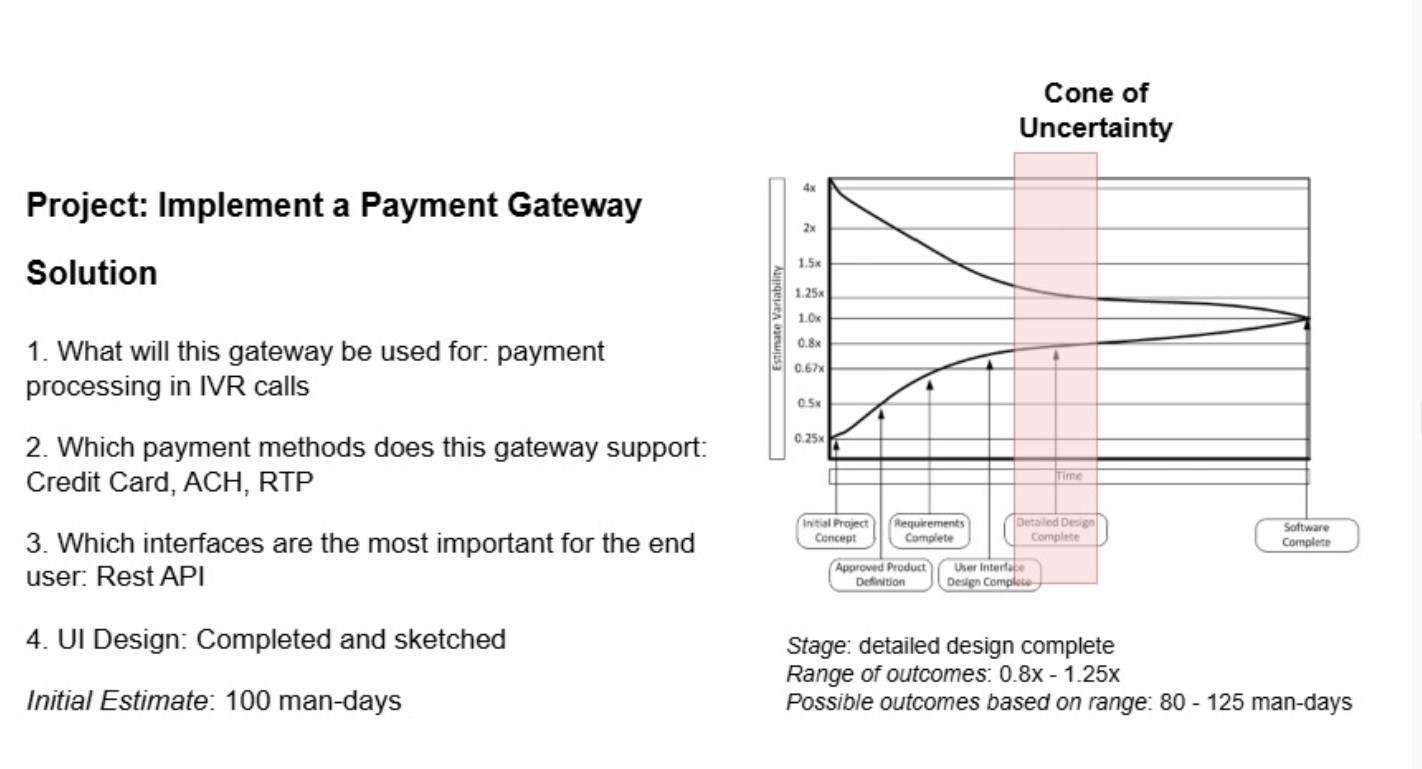
Statistically, according to the cone of uncertainty, an estimate for this stage will have a range of outcomes anywhere from 0.25x to 4.0x. In practice, this means that if the project is given an estimate of 100 days, based on historical data or just pure expert judgement, the possible outcomes can be anywhere from 25 days (being the most positive outcome) to 400 days (being the most negative outcome). With time, as product teams perform work that clarifies specifications and defines clear UI design, this estimate becomes clearer too. Once the most basic questions about functionality are answered and the initial design sketch for UI is possibly finished, the estimate can be further narrowed down to the slot in the cone which corresponds to the range of 0.8x to 1.25x. In the example of 100 man-days for the baseline, it will mean 80 to 125 days for potential outcomes.
Calculating Outcome with a Specific Level of Confidence
While it may be very representative to use an estimate range for presenting estimate, it is still often much more convenient to use a single number based on the given range and so called risk appetite. Risk appetite is an amount of risk an organization can take to achieve their objectives, in this case project goals. It is smart in general to select a reasonable expectations rather than to bet on high risk, however in some situations for example when the project team is quite experienced one may pick a higher risk.
So how do we determine a single estimate based on range and risk appetite? In order to do that we can calculate a Standard Deviation inside the range and then calculate the expected outcome effort based on level of confidence. Let’s take a look at those formulas.
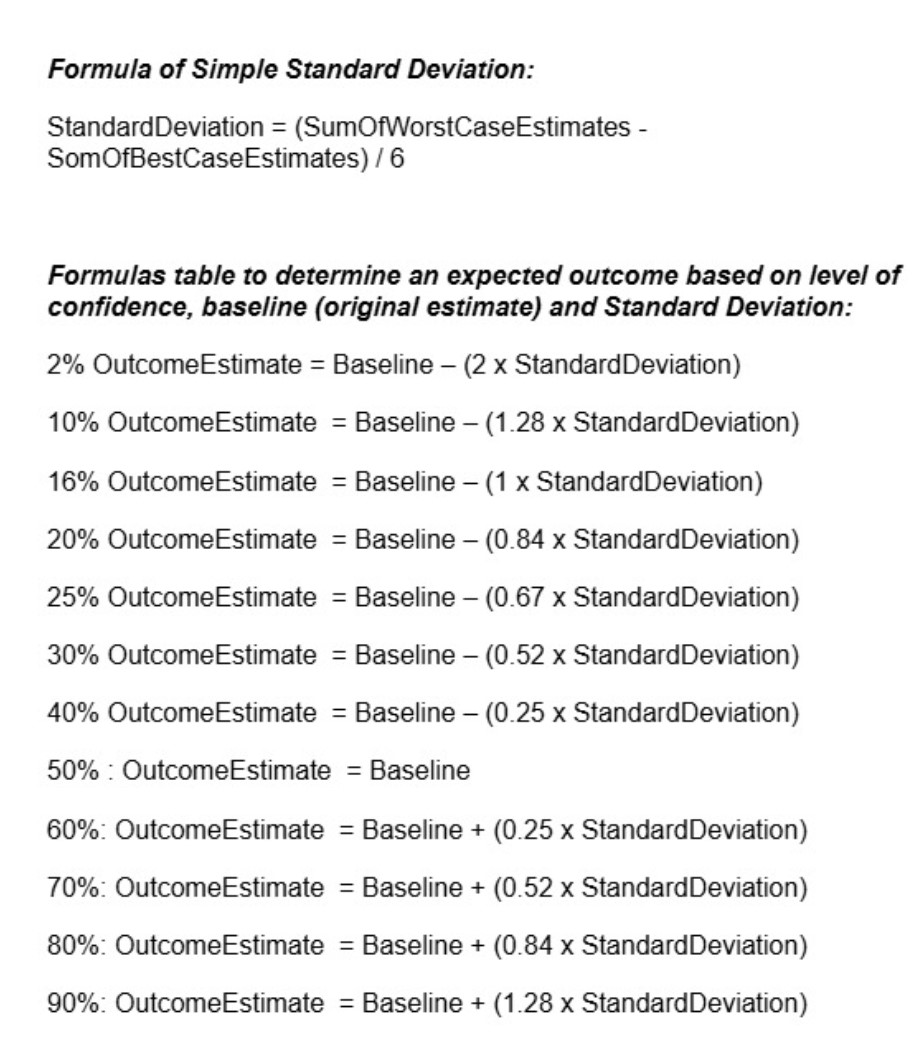
Source: Steve, McConnell. Software Estimation: Demystifying the Black Art (Developer Best Practices) . Pearson Education. Kindle Edition.
Both Standard deviation and the Outcome Estimate formulas are based on prior broad research on IT projects performance in the industry. They can be helpful in general case but can be tweaked based on historical organizational and teams’ performance. This formula is the simplest one.
Alright now let’s review a practical example where we will be using these formulas.
Practical Example of Calculating an Estimate with a Risk
Let’s assume that our project is in the Requirements stage and that the team has provided the following baseline estimates (in days) for the project tasks. Our goal is to evaluate an outcome estimate based on provided baseline estimates and the confidence level of 80%.
Project: Implement a Payment Gateway solution
- Task 1: Implement credit card payments 10 days
- Task 2: Implement ACH payments 15 days
- Task 3: Implement RTP payments 15 days
- Task 4: Implement Recurring payments 10 days
- Task 5: Implement payment settlement 50 days
Let’s apply the formulas we defined earlier.
Based on the stage of the project (which is Requirements) we can use the 0.67x for best case multiplier and 1.5x for the worst case multiplier according to the Cone of Uncertainty. Let’s calculate all necessary values for the equation.
Project: Implement a Payment Gateway solution
- Task 1: baseline 10 days, best case 6.7, worst case 15
- Task 2: baseline 15 days, best case 10, worst case 22.5
- Task 3: baseline 15 days, best case 10, worst case 22.5
- Task 4: baseline 10 days , best case 6.7, worst case 15
- Task 5: baseline 50 days, best case 33.5, worst case 75

Total: baseline 100, best case 67, worst case 150
Let’s calculate the standard deviation based on that data:
StandardDeviation = (150 - 67) / 6 =13.83Based on the confidence level we should select the following formula from the table to calculate the outcome estimate:
80%: Baseline + (0.84 x StandardDeviation)Let’s evaluate that calculation for our case
OutcomeEstimate = 100 + 0.84*13.83 = 111 daysWe got 111 days as an outcome estimate with 80% confidence level. Using that estimate will decrease our risks when executing a software development project and will ensure minimum stress on teams and clients with being on track on delivery expectations.
Useful Tools
It’s not necessary to perform all calculations manually. Some applications like Deep Planner account for risk automatically when building a roadmap. They add or deduct the buffer depending on estimate uncertainty and the desired risk appetite. To learn more, check the Deep Planner website and the related documentation about risk.
YouTube Video
If you want to discover this topic in full depth, please also check out the video version of this article. it is available here:
More Information about Planning and Helpful Insights
To subscribe to new content use links in About Us page. Also check out this blog for other articles related to Software Development planning!
[…] the risk factor for the estimate delivery. To do this properly please check out the article about the way to account for risk in estimates in this […]
[…] Let’s talk about some important considerations for Rolling Wave Planning. First is a risk factor. Since the scope and details are very high level on the first wave and are more detailed on later waves, the uncertainty and deviation of the resulting schedule in early phases can be high. Thus, it is very appropriate to account for risk in those phases and use deviation formulas in early phases to make sure estimates are provided with reasonable room for a risk. To learn more on how to do it properly, check out the article “How to Account for Risks in Estimates.” […]