
To define an agile roadmap, first of all, let’s set goals and expectations. Suppose that we have a software project and dozens of ideas in the backlog that we want to map somehow into a timeline. We also have multiple teams with different specializations and resources to manage. In this situation it would be really beneficial to create a product roadmap. Here is why:
- To provide high-level release date expectations for ourselves and our clients
- To define the scope of what we can do
- To understand how to allocate our resources or potentially hire someone new
Additionally, we have dozens and dozens of features and ideas coming in, and we want to be able to adjust the plan any moment. One example of that is the words of Steve Jobs. He wanted to remove “70% of the roadmap” at some point. So building an adjustable and flexible schedule is crucial for us.
Now that we defined what we want, let’s break down the process into a few steps:
- Identify the roadmap boundaries
- Identify the features (epics) for the roadmap
- Evaluate a high-level estimate for the features and their dependencies
- Define available resources
- Calculate the timeline to match features to team resources and the roadmap boundaries
Let’s go over each step to understand it in detail.
Step #1: Identify the roadmap boundaries.
How far ahead do you want to plan in the future? Is it the next month or the next quarter? Or maybe some custom dates? It’s very important to clearly define this parameter to ensure that you understand what your planning ambitions are, as well as the start and end date for the roadmap.
Step #2: Identify the features for the roadmap.
In this step, we should look at our backlog and identify good candidates for the planning period we defined in the previous step. It is important that the features are big enough to be trackable on a timeline. If it’s too big, especially after completing the evaluation described the next step, consider splitting it into a few smaller features.
Step #3: Evaluate a high-level estimate for these features and their dependencies.
This step is important to understand the weight of the features that we are working with. High-level estimates can be represented by a single record; however, it’s much better to present it as a number of records, with each record representing a particular type of job required, and specialization, for better accuracy of schedule results. If you want more information on how to evaluate a high-level estimate for a feature you can review a dedicated article on that topic. Besides the estimate, you may also want to define dependencies in this step to have a better logical reference in your roadmap.
Step #4: Define available resources.
The resources we’re talking about are teams—their roles, specializations, and velocity. Each team is unique and may have different skill sets and professional levels. Based on that, they can produce a different output. It is essential to record this output in this step. Write down team velocity and their responsibilities in the process.
Step #5: Calculate the timeline.
This is the key step in our process. It is important to understand that one can use multiple strategies to execute the features. Let’s take a look at some of them.
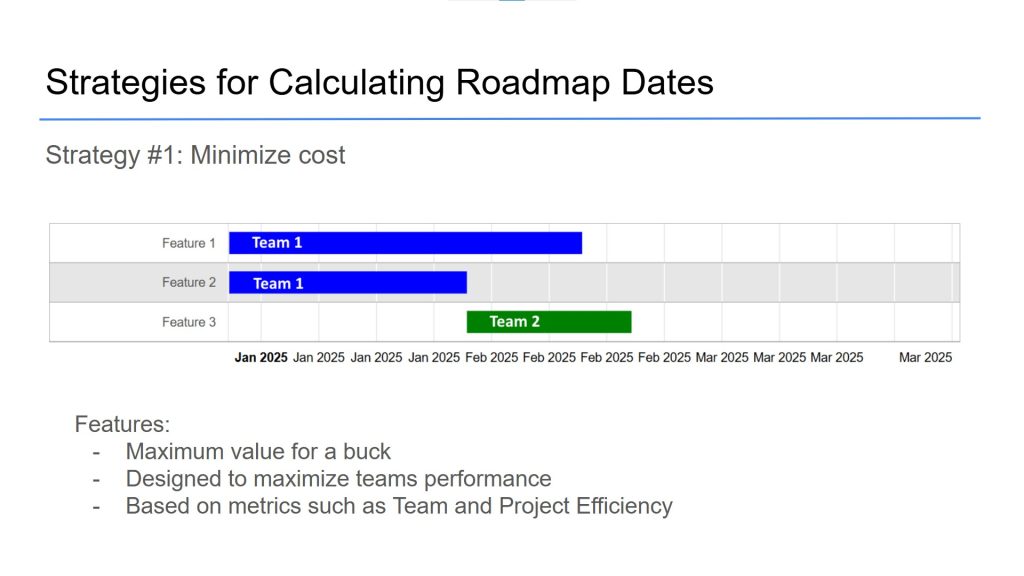
Strategy #1: Minimize cost. This strategy is optimal to achieve maximum value for a buck. The features are stacked in a timeline the way that team velocity is used by maximum and there is no possible idle time for teams in the schedule. To implement this strategy, one needs to match the teams to features and find the best matching combination to maximize team performance. While this strategy is effective, it’s important to put reasonable limits to make sure that teams are not overloaded with work and projects. Some metrics like Project and Teams efficiency can help with that. I talked about these metrics in the post about Resource Utilization. Some additional metrics could include burnout indicators, sustainable pace, or buffer times to maintain team health.
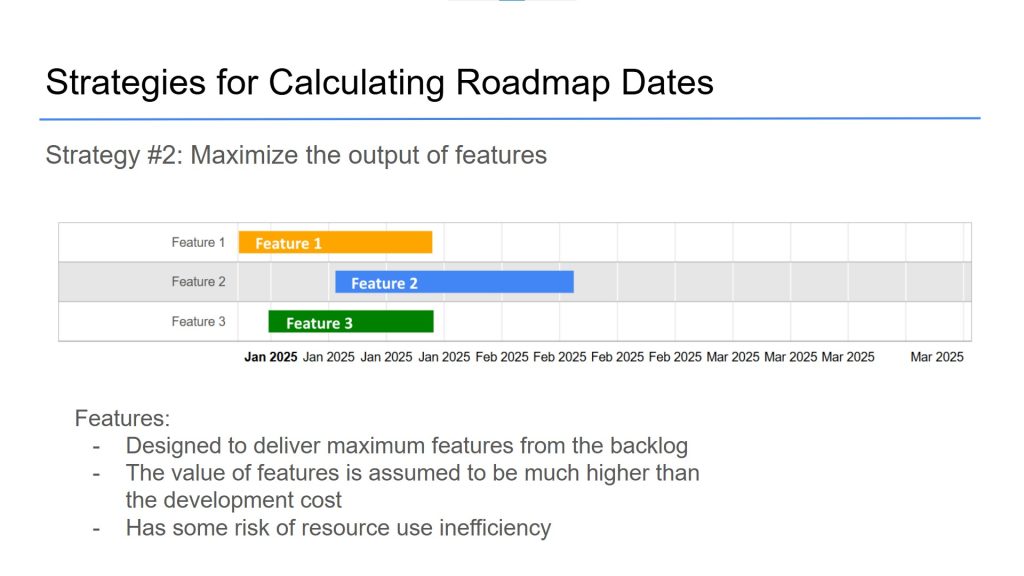
Strategy #2: Maximize the output of features. This strategy is optimal to deliver the maximum features from the backlog. In this case, the cost may not be the final factor because each feature by its value may be much higher than the immediate development cost, and the timeline will, first of all, try to accommodate the delivery of as many features as possible. While this strategy can sound attractive for managers and stakeholders, it’s still important to balance it with the availability of resources, potentially fine tuning the algorithm to allow deviations for better resource utilization.
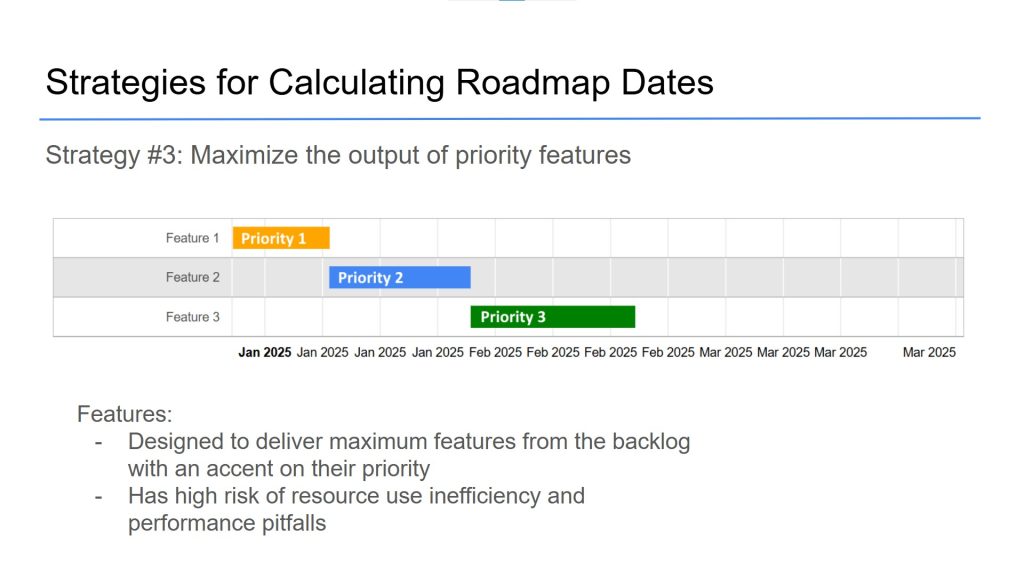
Strategy #3: Maximize the output of priority features. This could be named a variation of the previous strategy but with the proper accent on feature priority. Whatever goes first on the backlog should go first on a timeline–this is the main idea of this strategy. While this strategy can seem really attractive to stakeholders, one needs to use this strategy with great care as it has a really high risk of resource use inefficiency and performance pitfalls. Thus it must be balanced with proper resource utilization strategies.
Let’s go over a practical example to define a roadmap to see the picture in a closer look.
Practical Example
Let’s assume that we need to build a Payment Gateway Solution. Let’s go over each step to define a timeline.
Executing Step #1: Identifying the roadmap boundaries.
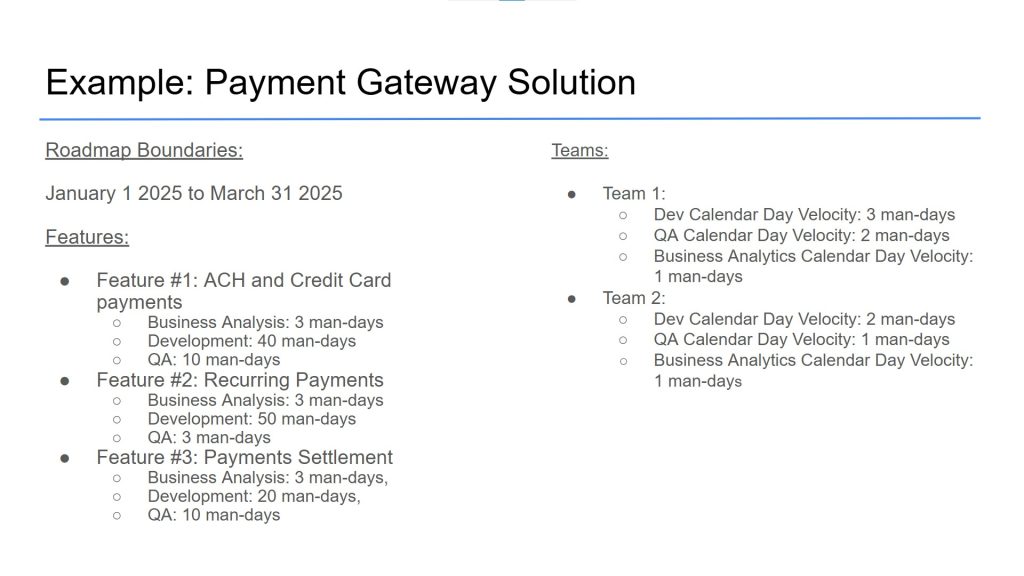
Let’s say we plan it for the first quarter of 2025, so it will be January 1st 2025 to March 31st 2025. Also just for the record, the amount of business days for these boundaries is 60.
Executing Step #2: Identifying the features.
Let’s assume that we need to implement the following features for this project:
- Feature #1: ACH and Credit Card payments
- Feature #2: Recurring Payments
- Feature #3: Payments Settlement
Executing Step #3: Evaluating a high-level estimate.
Let’s assume that we have the following estimates for these features, provided by the technical team:
Feature #1: ACH and Credit Card payments
- Business Analysis: 3 man-days
- Development: 40 man-days
- QA: 10 man-days
Feature #2: Recurring Payments
- Business Analysis: 3 man-days
- Development: 50 man-days
- QA: 3 man-days
Feature #3:
- Business Analysis: 3 man-days
- Development: 20 man-days
- QA: 10 man-days
If you are not sure what these numbers mean or how they are calculated, refer to the article How to Create a Good Estimate for a Feature.
Executing Step #4: Defining available resources.
Let’s assume that we have two teams available to perform the work needed for our project. Calendar day velocity constitutes to a measurement that defines how many man-days the team can
contribute per calendar day, for example if the team has 3 developers, 2 testers and 1 business analytic, their velocity can be defined as 3, 2 and 1 man-days correspondingly.
Team 1:
- Dev Calendar Day Velocity: 3 man-days
- QA Calendar Day Velocity: 2 man-days
- Business Analytics Calendar Day Velocity: 1 man-days
Team 2:
- Dev Calendar Day Velocity: 2 man-days
- QA Calendar Day Velocity: 1 man-days
- Business Analytics Calendar Day Velocity: 1 man-days
Executing Step #5: Calculating the timeline.
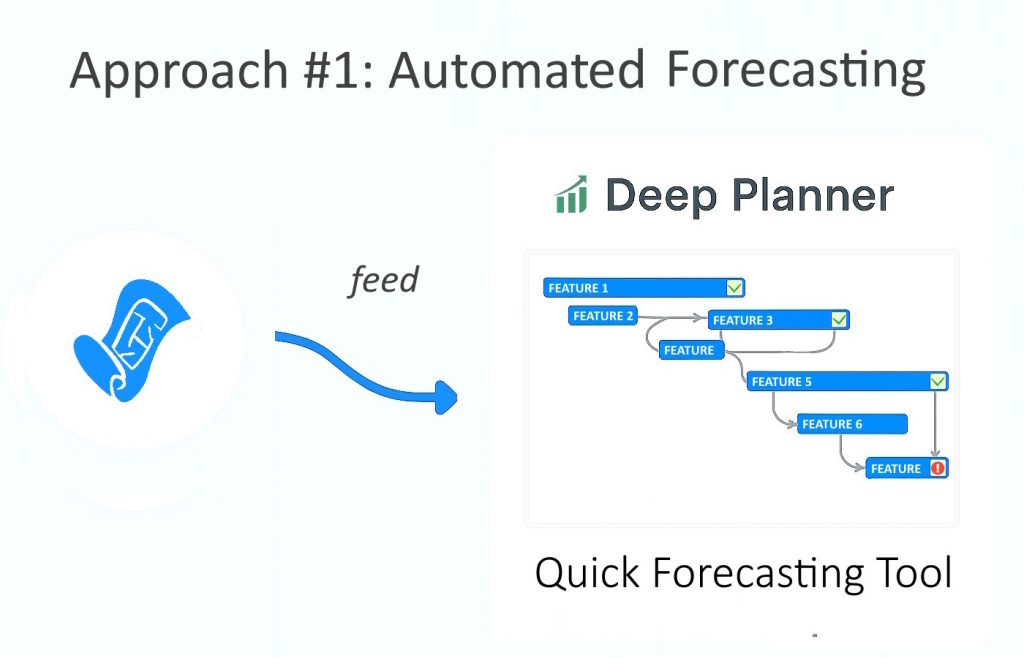
The easiest way to map all the data into a timeline is to use a simulation tool that can create a quick forecast based on provided data.
I recommend using Deep Planner – it’s a tool specifically designed to create roadmap forecasts.
The tool focuses on both optimizing the output of priority features and minimizing the cost, and it’s easy to use.
No math required! Everything is calculated behind the scenes. You just input data and generate the forecast.
For more insights to this approach refer to the article how to generate an agile roadmap with Deep Planner.

MATH ALERT: For the sake of presentation let’s select a more complicated and detailed manual approach. It will require some skills in math. Hang tight, it’s going to be fun 🙂
OK, let’s get to it.
Let’s use a strategy that minimizes cost and makes teams less idle. The core concept of this strategy is to prioritize the teams most efficient in implementing features. Some formulas, in particular the idea of calculating project efficiency was taken from the book of Juval Lowy called “Righting Software”
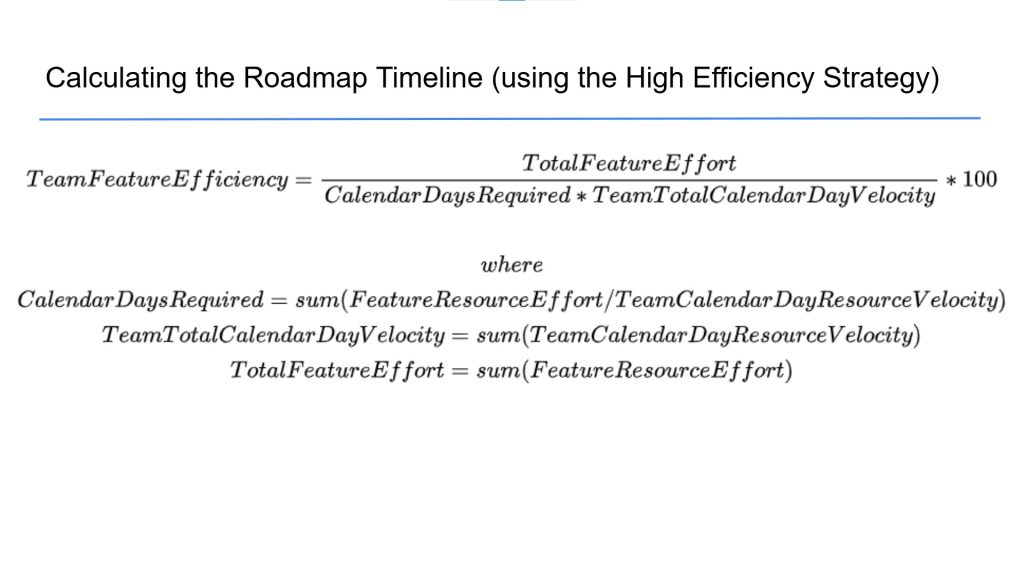
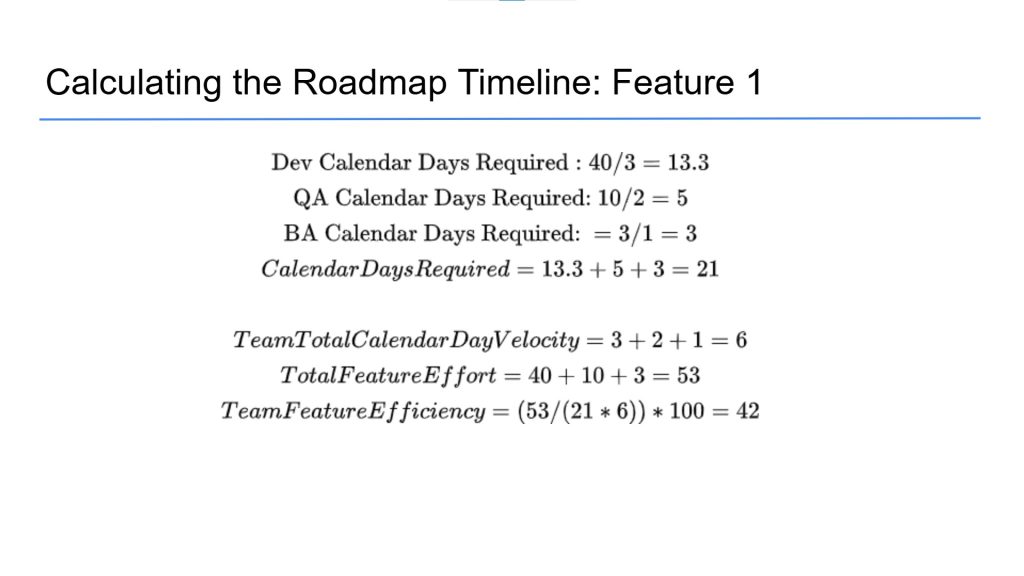
Let’s use those calculations in our example. To calculate team efficiency, we need to first calculate the number of calendar days that the feature will take for the team to implement. In order to do that, we need to divide the feature effort for each resource by team calendar day velocity for each resource and sum them together. For example, in feature 1:
Then we need to calculate the total team velocity. In order to do that, we need to sum together the team calendar day velocities for all resources.
To calculate feature effort, we just need to sum up the effort estimate for all resources of our feature.
Finally, to get team efficiency, we need to divide the feature effort by total available team velocity for the calendar days scheduled.
With this calculation we can say that the Team 1 efficiency for implementing feature 1 will be 42%.
Let’s calculate the other efficiencies the similar way:
| Feature 1 | Feature 2 | Feature 3 | |
| Team 1 | 42 % | 44 % | 37 % |
| Team 2 | 53 % | 57% | 47% |
In our case, feature #2 implemented by team #2 is a winner, so it will be the first feature that will go on the roadmap. This feature will take 31 man-days that corresponds to half of the quarter in our timeline.
Next step is adding a new feature to our schedule. Now that we have one feature, we need to subtract the resources from our teams to make sure we account for it when planning. To calculate the available resources, we need to subtract 57% from each teams’ activities performances. Let’s subtract and round the remaining velocity:
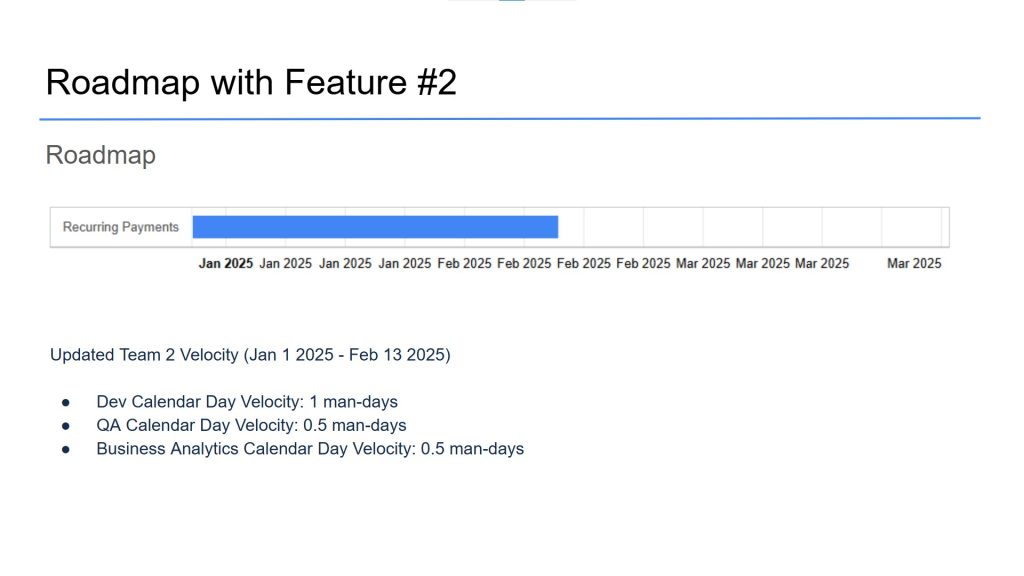
With this match, we could find the next combinations; however, it seems too low to even consider using Team 2 to implement any features in parallel because the efficiency will be extremely low. So, we can just use Team 1 feature 1 and schedule it in parallel to the already scheduled feature for Team 2. According to calculations we did earlier, it will take 21 man-days to implement this feature, which will correspond to around 1/3 of our timeline.
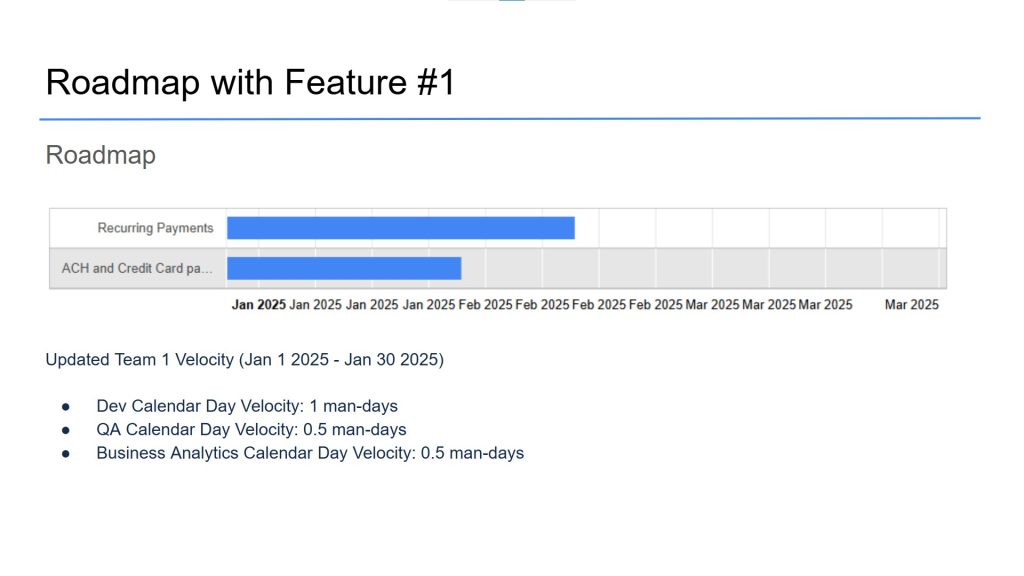
We have also updated the team 1 velocity to reflect the assignment.
Finally we need to decide – what do we do with feature #3. Should it be scheduled to Team 1 or Team 2?
From our initial calculations, we can see that Team 2 would be more efficient than Team 1 to implement that feature, but Team 1 is released earlier than Team 2 for implementing the feature assigned to them. With that we can make an assumption that the 10% difference in efficiency will be compensated by the two workweeks difference between them. With that in mind, let’s schedule Feature 3 to Team 1. Through our calculations, it will take around 15 man-days to implement Feature 3 (Jan 30 2025 to Feb 19 2025).
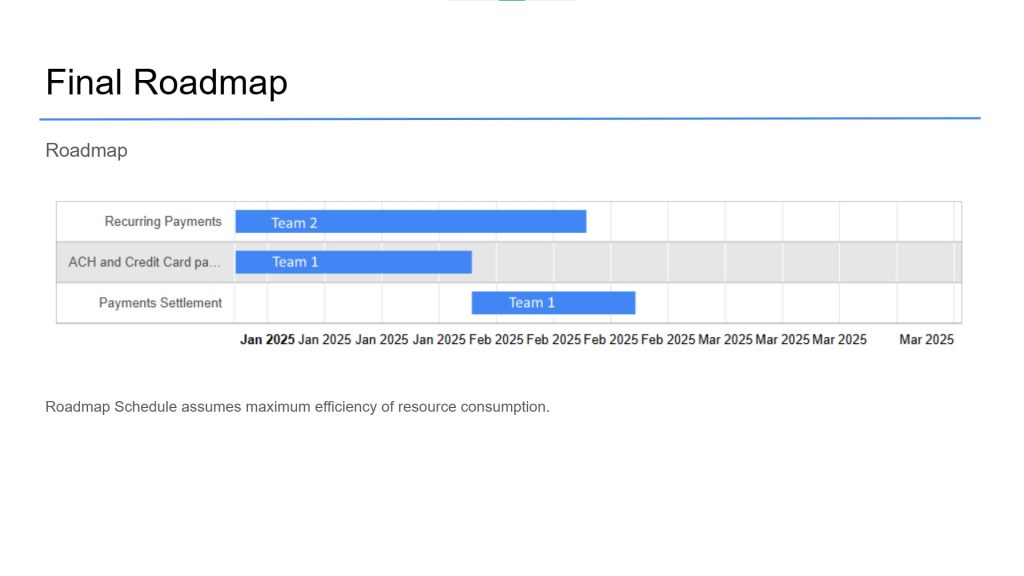
This roadmap corresponds to the most resource efficient schedule for implementing selected features with the resources available.
Changes Adoption
One last point here. Let’s consider an example when somebody comes and asks to change the schedule because a new feature just came in or there is a drastic change to feature estimates. Try to guess what needs to be done in this case… Exactly, just go over the same steps!
Start with Step #1. Did you already go through half of the roadmap? In that case, adjust the boundaries to reflect it. Completed a feature and added a new one? Adjust the feature list in Step #2 and Step #3. New team member? Time to adjust Step #4. Just add a feature to the list, update all features completion status and change estimates accordingly. Complete your adjusted schedule with calculating a new timeline. Recalculate all efficiencies and stack the features according to the new numbers. Don’t forget to notify your teams about the changes made! Having an effective and comprehensive algorithm allows for quick changes and flexible schedules that can simplify and advance the whole development process.
YouTube Video
If you want to discover this topic in full depth, please also check out the video version of this article. it is available here:
More Information about Planning and Helpful Insights
To subscribe to new content use links in About Us page. Also check out this blog for other articles related to Software Development planning!