
Today we’re going to be talking about network diagrams as an instrument that helps visualize tasks required to execute software development project.
First, let’s take a step back and imagine that we work on a software project. We know that the software project consists of multiple work tasks that are required to be completed. The work tasks may include business analysis, development, testing, and so on. When implemented, the project will generate value in the form of business features.

Often, especially in the modern popular Microservice architecture, the system has multiple services where the changes are made and deployed to each individual service independently. Depending on implementation, there may be loose or tight couplings between the components; however, in general, those components have a strict dependency relation.

Besides work required in the services it is often required to perform some auxiliary items such as architecture analysis and end to end testing. Let’s add them here as well. The final view look like this:

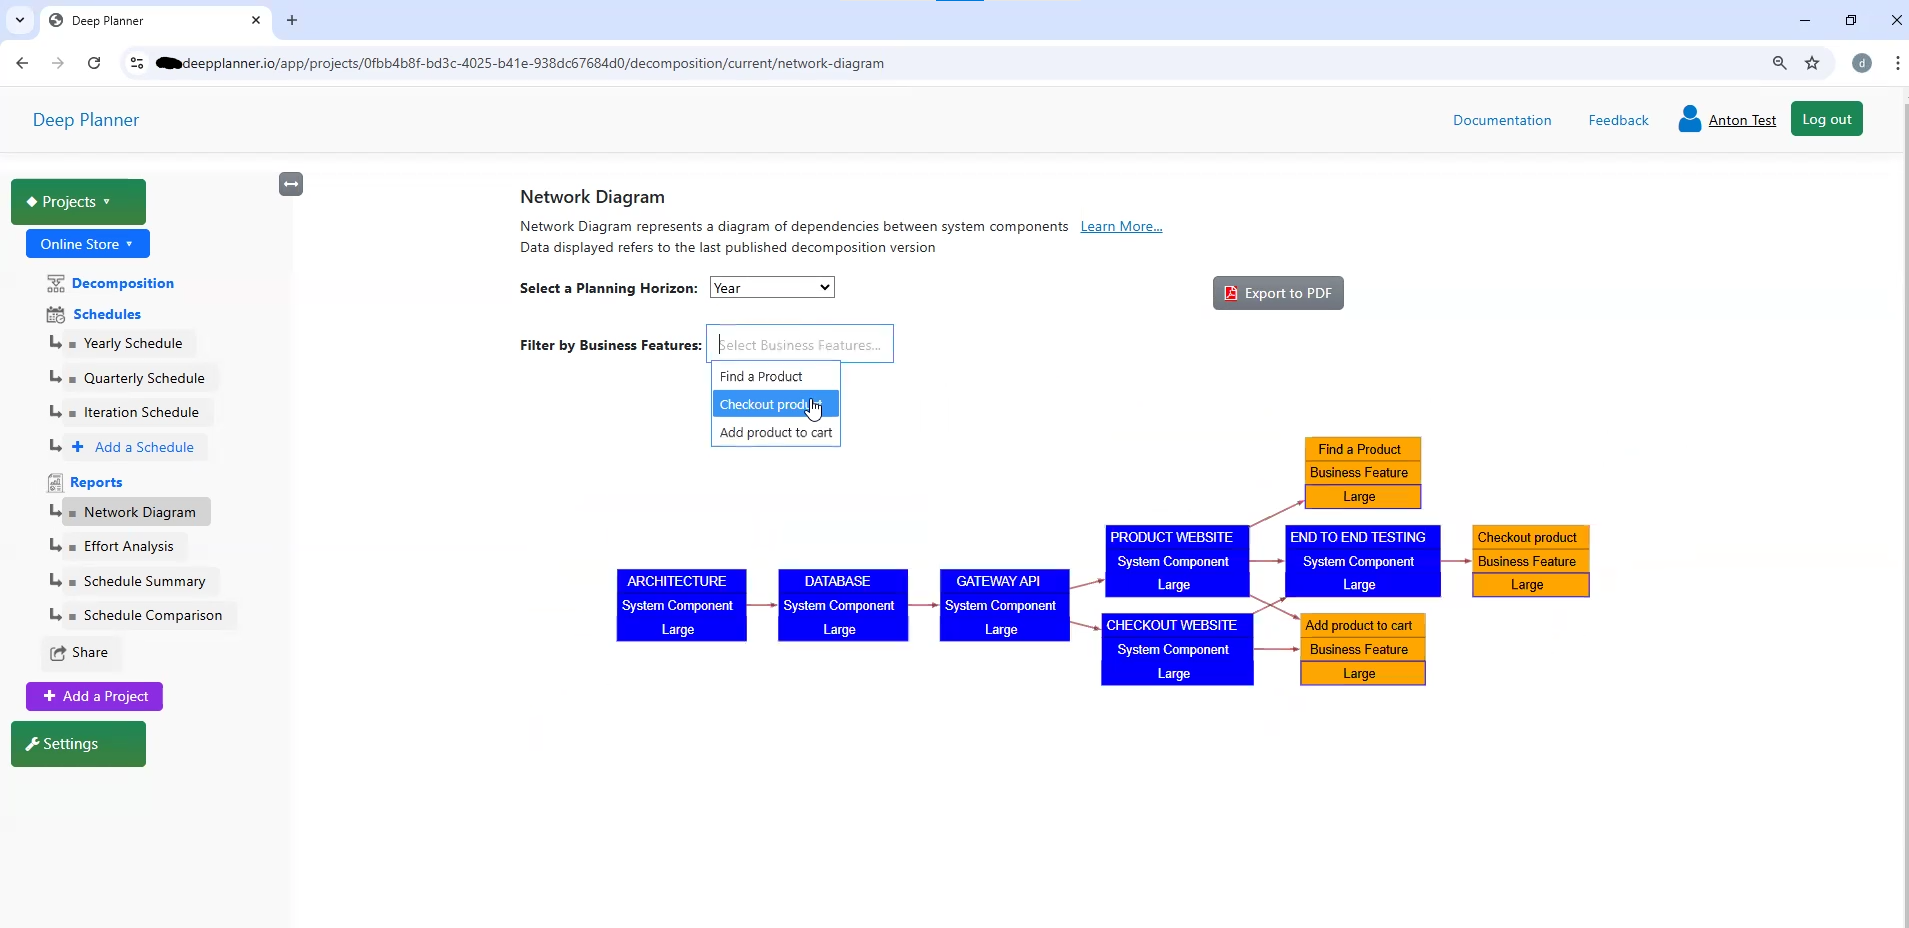
The diagram we see on the picture is called a Network Diagram, or some also call it a Dependency diagram. Basically, it’s a representation of project tasks in a form of a graph where node items are tasks (in our case attached to changes in particular components) and arrows between them are dependencies between those tasks.
Network diagram can be a powerful instrument for multiple purposes. Let’s review each purpose in particular.
Purpose #1: oversee all tasks required to implement the project in a convenient format. As you can see visually it is very convenient to get the idea of all changes and jobs required to be implemented. When using particular tools such as Deep Planner you can enter all tasks into the system and oversee them in a convenient format, plus zoom in and discover particular areas. You can also filter by business features you want to implement and, in this way, get the idea which scope you actually need for the current project phase.
Purpose #2: schedule and parallel work of teams. Having a network diagram on the table allows to utilize team resources more effectively by assigning work in parallel where it is possible to arrange that.

Purpose #3: calculate a critical path. Critical path is the longest path in the network. Even if all dependencies are properly paralleled the project time can’t be less than the critical path time.

As you can see, a network diagram represents an awesome instrument that can help a lot in planning and software development routine and thus is considered one of the essentials of the proper software project design.
Video
There is also a video version of this video. To learn more please check out the link below.
More Information about Planning and Helpful Insights
To subscribe to new content use links in About Us page. Also check out this blog for other articles related to Software Development planning!
[…] diagram for better visibility. To learn more about network diagrams, please check out the related article in this blog […]